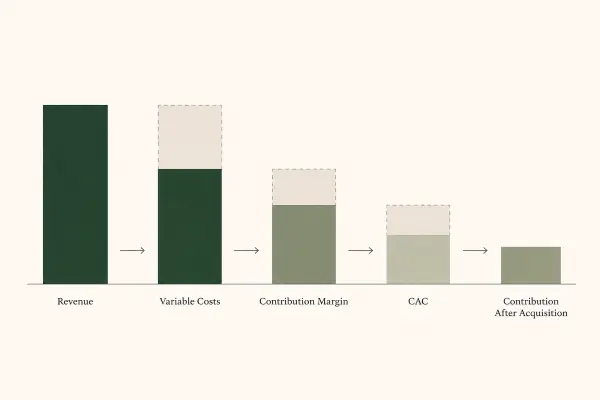
ROAS tells you how much revenue you generated for every dollar spent on advertising. It does not tell you how much of that revenue was actually available after delivering the product or service. That is where contribution margin becomes useful. For marketers, the practical sequence is:
Revenue → variable costs → contribution before acquisition → CAC → contribution after acquisition
Once you see performance this way, CAC and ROAS stop being isolated campaign metrics and become part of the business economics behind growth. if you want to know what is contribution margin and how to work with it be with me on amin farahani‘s blog.
What Contribution Margin Actually Means
The Basic Formula
Contribution margin is the amount of revenue left after subtracting variable costs.
Contribution Margin = Revenue − Variable Costs
You can also express it as a percentage:
Contribution Margin % = Contribution Margin ÷ Revenue
Suppose an order generates $100 in revenue and has $50 of variable costs. $100 − $50 = $50 contribution margin, The contribution-margin ratio is:
$50 ÷ $100 = 50%
That $50 is not automatically profit. It still needs to help cover fixed costs such as salaries, rent, software, and other operating expenses. Once those fixed costs are covered, additional contribution can flow toward profit. That distinction matters because marketers sometimes treat anything left after product costs as “profit,” which can make acquisition economics look healthier than they really are.
Which Costs Count?
A variable cost generally increases when you make another sale. Depending on the business, that might include:
- Cost of goods sold
- Shipping and fulfillment
- Packaging
- Payment-processing fees
- Variable sales commissions
- Refunds or expected returns
- Other costs directly tied to serving another customer
Fixed salaries, rent, and normal software subscriptions generally don’t belong in unit-level contribution margin because they don’t increase directly with every additional transaction.
Gross margin and contribution margin are also not necessarily the same thing. Gross margin may only account for the direct cost of producing the product, while contribution margin can include additional variable costs such as fulfillment and transaction fees. For marketers, that fuller cost view is usually more useful.
The Marketing Distinction That Matters: Before vs After Acquisition
One source of confusion is whether advertising spend should be included in contribution margin. Different businesses use different definitions, so I would avoid relying on the label alone. Define exactly which costs are included. For marketing decisions, it is useful to separate contribution into two levels.
Pre-Marketing Contribution Margin
Think of pre-marketing contribution as the value available before you pay to acquire the customer.
Pre-Marketing Contribution = Net Revenue − Variable Costs Before Acquisition
Suppose an order generates $100 in net revenue. The variable costs are:
- COGS: $35
- Shipping and fulfillment: $7
- Payment processing: $3
- Returns and discounts: $5
Total non-marketing variable costs:
$35 + $7 + $3 + $5 = $50
So:
$100 − $50 = $50 pre-marketing contribution
This is the economic room available for customer acquisition before the order stops contributing anything on a first-order basis.
Post-Marketing Contribution
Now suppose the customer costs $30 to acquire.
Post-Marketing Contribution = Pre-Marketing Contribution − CAC
So:
$50 − $30 = $20
That $20 is what remains from the order to help cover fixed operating expenses and, eventually, profit. For me, this separation is much more useful than arguing about whether advertising “belongs” inside the official contribution-margin formula. The first number answers:
How much can we afford to spend acquiring this customer?
The second answers:
What did the customer leave behind after acquisition?
Why ROAS Without Contribution Margin Can Mislead You
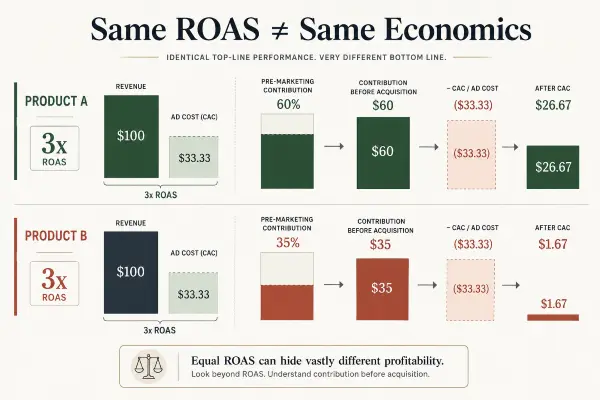
Consider two paid media campaigns. Both generate:
$100 revenue per order
Both report:
3x ROAS
At 3x ROAS, the advertising cost per order is:
$100 ÷ 3 = $33.33
On the surface, the campaigns look identical. Now add contribution margin. Product A has a 60% pre-marketing contribution margin:
$100 × 60% = $60
After acquisition:
$60 − $33.33 = $26.67
Product B has a 35% pre-marketing contribution margin:
$100 × 35% = $35
After acquisition:
$35 − $33.33 = $1.67
Same revenue, Same ROAS Very different economics. Product A leaves about $26.67 after acquisition. Product B leaves only $1.67. That is why a universal statement such as “3x ROAS is good” doesn’t mean much without knowing the underlying margin. ROAS tells you how efficiently advertising generates attributed revenue. Contribution margin tells you how much economic value sits underneath that revenue.
Use Contribution Margin to Set CAC and ROAS Guardrails
Contribution margin becomes especially useful when you turn it into acquisition thresholds.
Find Your First-Order Break-Even CAC
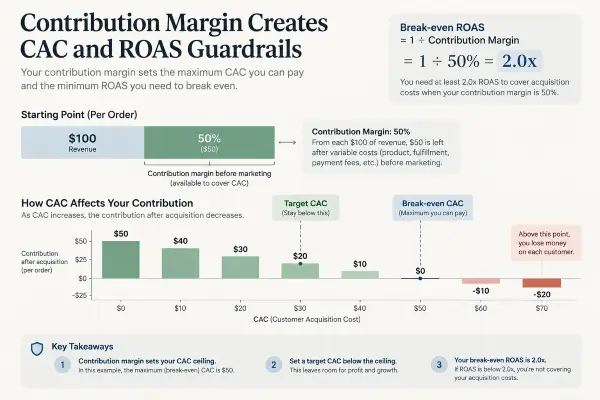
Go back to the example with:
$100 revenue
and:
$50 pre-marketing contribution
If CAC reaches $50:
$50 contribution − $50 CAC = $0
So the approximate first-order break-even CAC is:
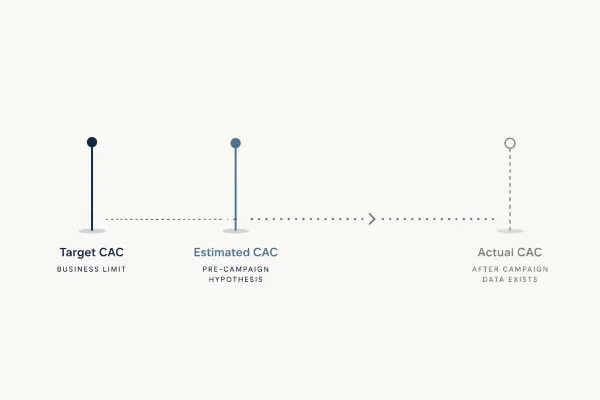
Break-even CAC = $50
That doesn’t mean $50 should become your target CAC. At $50, there is nothing left from the first order to cover fixed salaries, software, agency fees, rent, or profit. So:
Break-even CAC ≠ Target CAC
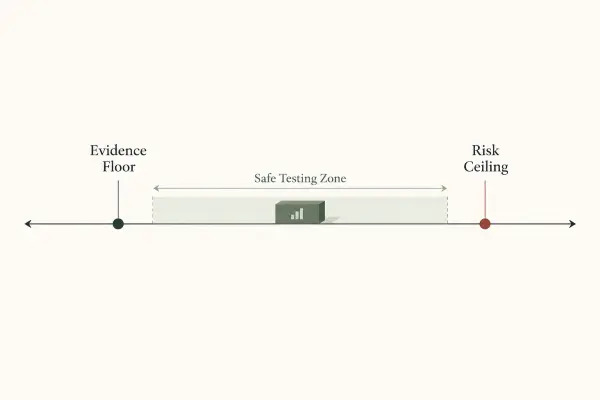
Break-even is better treated as a ceiling under the assumptions in your model. A business may intentionally accept a first-order loss because repeat purchases create attractive lifetime economics, but that is a separate decision. You shouldn’t assume future value will rescue weak first-order economics without evidence.
Calculate Break-Even ROAS
If you know the pre-marketing contribution-margin percentage, you can also estimate break-even ROAS.
Break-even ROAS = 1 ÷ Pre-Marketing Contribution Margin %
If the contribution margin is 50%:
1 ÷ 0.50 = 2.0x
At roughly 2x ROAS, the advertising consumes all $50 of contribution available from each $100 of revenue. Below 2x, the modeled transaction loses contribution before fixed costs. Above 2x, some contribution remains. Again, 2x isn’t automatically the target. It is the modeled break-even threshold based on the costs you’ve included. The operating target usually needs to sit above that level unless there is a deliberate reason to accept lower first-order contribution.
How Marketers Should Use Contribution Margin in Real Decisions
Compare Products, Offers, and Channels
Products with different margins shouldn’t automatically share the same CAC or ROAS targets. A higher-margin product can often afford a more expensive customer acquisition cost while still creating healthy contribution. Offers can create the same issue. A discount might improve conversion rate and make a campaign look better inside the ad platform, while simultaneously reducing the contribution generated by each order.
That means marketers should look beyond revenue when deciding which products and offers deserve more paid-media exposure. The same applies to channel comparisons. A channel generating a lower apparent ROAS can still be financially attractive if it brings customers buying higher-margin products or producing better contribution.
Decide Whether Scaling Is Actually Helping
Contribution percentage isn’t the only number that matters. Total contribution dollars matter too. Suppose Channel A generates:
$25 contribution per customer × 500 customers = $12,500
Channel B generates:
$40 contribution per customer × 200 customers = $8,000
- Channel B has better economics per customer.
- Channel A creates more total contribution.
So the better scaling question isn’t simply:
Which channel has the highest contribution percentage?
It is:
Does the additional spend still generate enough contribution to justify putting more money into the channel?
That matters because acquisition efficiency often worsens as spending rises. A channel that works well at $20,000 per month may not produce the same economics at $100,000.
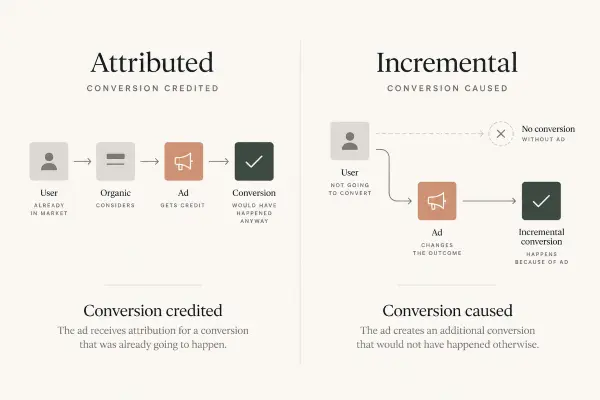
Contribution margin also doesn’t solve attribution or incrementality. It tells you whether the economics are healthy if the customer or revenue belongs to that marketing activity. Determining whether the channel actually caused additional demand is a separate measurement problem, which is where incrementality testing becomes useful.
Common Contribution Margin Mistakes Marketers Make
A contribution-margin calculation is only useful if the cost structure behind it is realistic. One common mistake is using gross margin while ignoring fulfillment, transaction fees, refunds, returns, or other variable costs. That usually makes allowable CAC look too generous. Another is treating contribution margin as net profit. Fixed operating costs still have to be paid.
Marketers should also avoid using one company-wide margin when products have very different economics. A blended 50% margin can hide one product at 70% and another at 30%, even though those products shouldn’t necessarily have the same acquisition target. Be explicit about whether CAC is included in the number you’re calling contribution margin, and don’t treat break-even CAC as the desired operating target.
Revenue tells you what came in. Contribution margin tells you what was economically available. CAC tells you what you spent to acquire the customer. What remains after those costs is what determines whether growth is helping the business rather than simply making the revenue number larger.
A useful next step is to calculate the pre-marketing contribution margin for the products or customer groups currently receiving the largest share of your paid-media budget. That number gives your CAC and ROAS targets a financial reason to exist. For doing all of this you most have data from your previous campaigns but what if you didn’t have enough data ? no need to panic, you can read my blog : How to set marketing budget without historical data .